Login
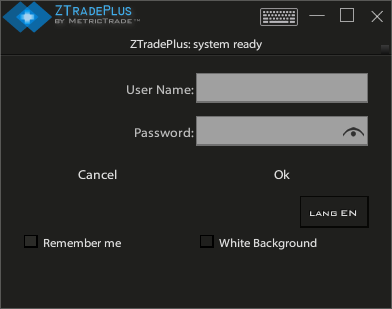
Log into the application
You can log into the app by entering the correct username and password.
If "Remember me" option is selected your username is being stored at the current device.
Orders and Portfolios
Place Order
In order to place an order you can:
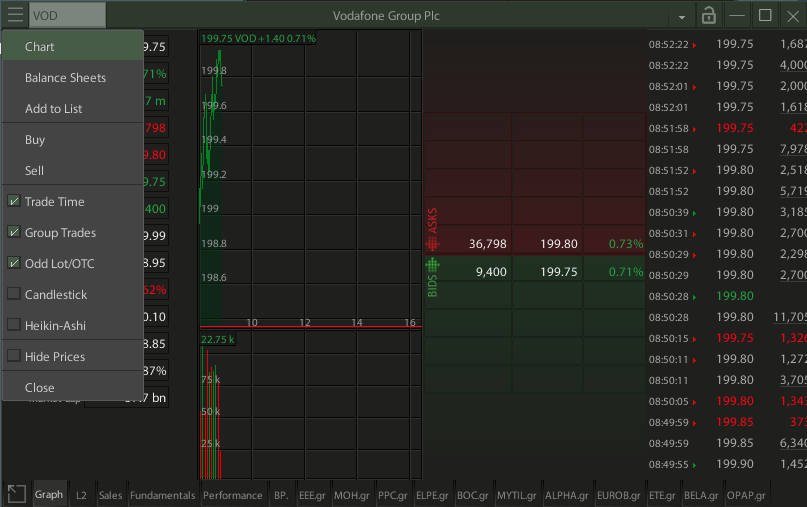
a. Right (or long) click on a symbol and select Buy or Sell on menu.
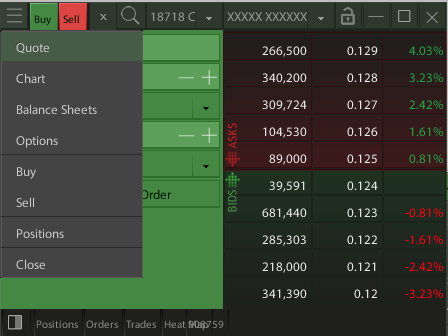
b. From Options icon(on top left corner) select Buy or Sell.
c. On Tablet or PC simple click on bid or ask price/size of symbol row in a Watchlist/Portfolio.
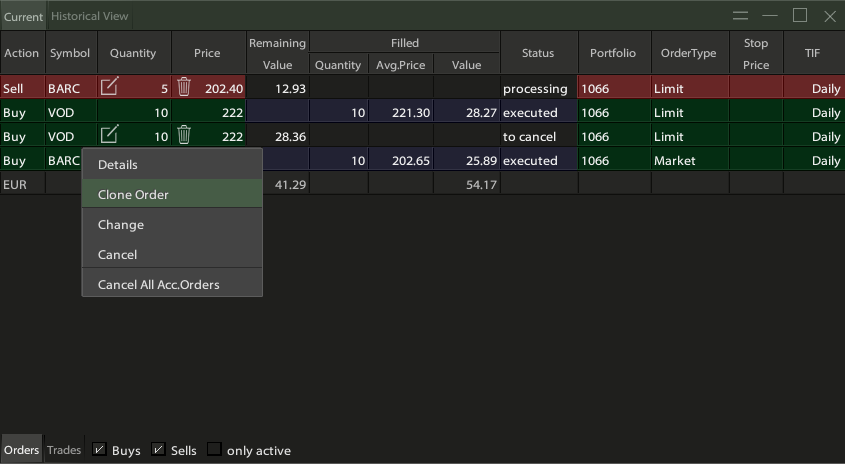
d. From Order List click on an order and select Clone Order.
e. Click on Orders shortcut iconin main menu.
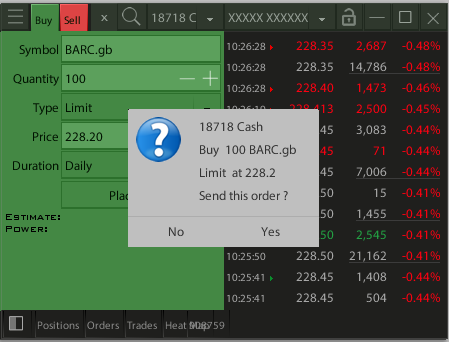
The order window will be open as temporary (full) screen in a Phone or as small pop-up window in a Tablet or PC.
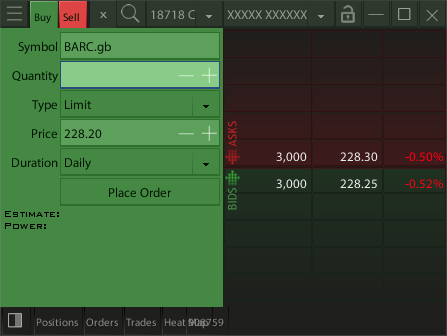
When you fill all fields press the Place Order button to preview your order, and then press Yes (or Enter) to send the order.
View Orders / Change / Delete
To view your Orders List you can select the positions options at the top left of Portfolio screen or New Order Screen or by pressing the "Orders" selection at the bottom line of the portfolios or orders window. Or by clicking on Windows -> New -> Orders from Main Menu.
In Order List the user can:
Click at any order row to activate menu in order to Clone, Change, Cancel the selected order or All Orders of the current portfolio.
By selecting the Only Active option (at bottom line of the window) you can hide cancelled or filled orders.
By selecting the Trades tab (at bottom line of the window) you can view only your executions and group them by symbol.
Portfolios
To view your Positions
In order to view your positions click on Window -> New and the select Portfolios or click on Portfolios shortcut icon  that is being displayed in main menu.
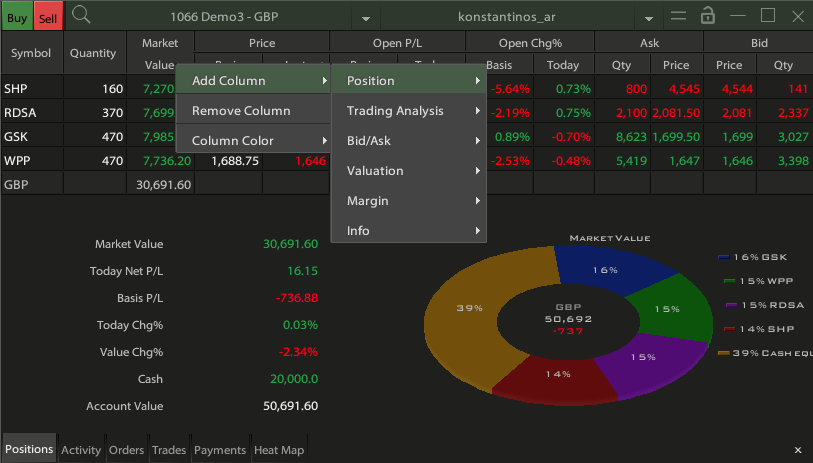
Right (or long) click on any column label to remove current column or add a new one after it.
Drag the summary/performance pane to see summary or performance or distribution of your portfolio.
Settings
Open Settings
In order to open settings click on Window -> Settings. The settings include:
a. Font Size : You can set the font size to Small / Normal / Big / Bigger to make it easier to read.
b. Line Height : Changing the line height, automatically increases the size of the buttons so you can press them easily.
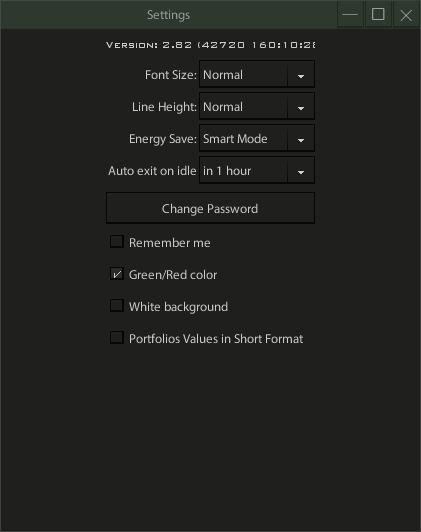
c. Auto exit on idle : The application closes automatically after the time specified in the option 10 minutes / 1 hour / 2 hours to stop consuming energy and data.Under a battery level (30%) it will ignore this option and will be turned off after 10 minutes of inactivity. (This feature is not applicable on Desktop Version).
e. Change Password : Use this button to change your password (It is applicable only for a MetricTrade UserName/Password).
f. Use vibration on Alerts : You can enable or disable vibration when viewing a new alert.
g. Remember me : Store username (password only for a MetricTrade account) in the app.
h. Green/Red Color : Use Green/Red color instead of Blue/Red.
i. Portfolios Values in Short Format : Show short representation of values and cut decimals in portfolios, like 23.34K instead of 23.340,12.
All of the above settings are related to the particular device and are not transferred like the other elements of your choices.
Watchlists
Open
In order to open a new Watchlist click on Window -> New and the select WatchList.
Add/Remove symbol from List
A new symbol can be added to the list that is being displayed by clicking on options button at the top right corner of the Watchlist Window and then -> "Edit List".
The window that opens displays the symbols that the list contains.
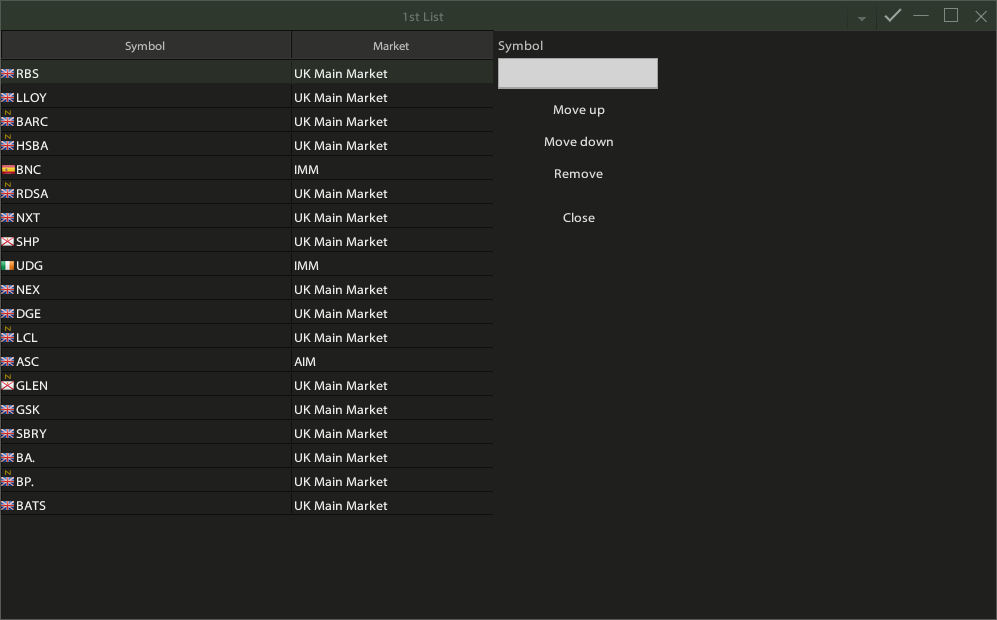
In order to remove a symbol click on the symbol you want to remove and the click on "Remove" Button. To add a new symbol to the list type its name or symbol on the "Add Symbol" textfield. "Move Up" and "Move Down" buttons can be used to rearrange the symbols in the list. Once you have finished the edit of list, click on "Tick" button  that is displayed at top right window corner.
Watchlists as all of the application's data, are being stored in your personal profile and as a result they are common across all your devices (when you login with the same username).
Create New List
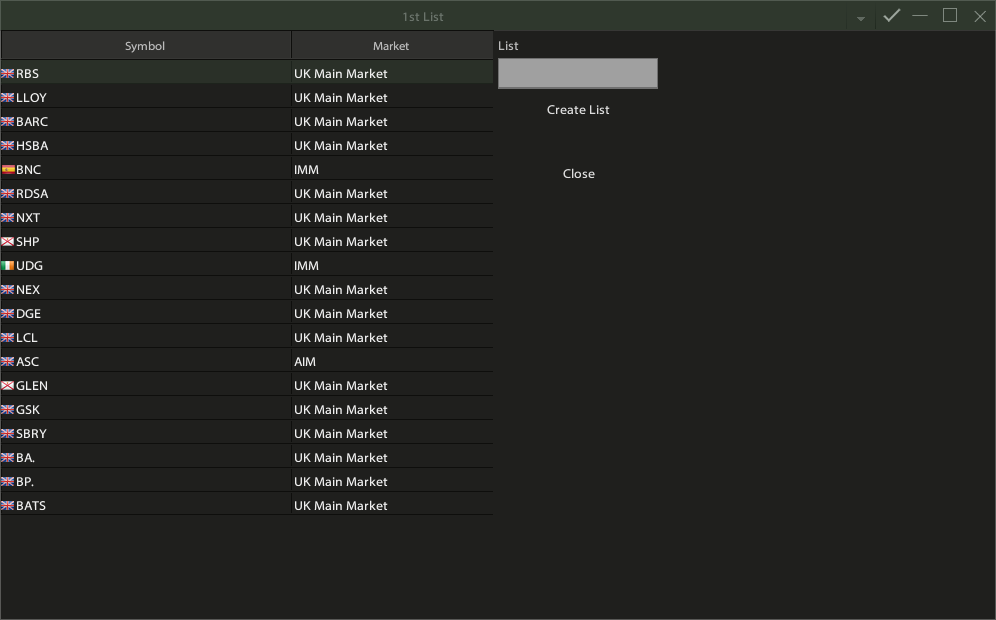
In order to create a new Watchlist click on options button at the top right corner of the Watchlist Window and then -> "New List".
In List textfield type the name of the list and click on button"Create List". Then you can add any symbol by typing it on "Symbol" textfield. Once you have finished the edit of list, click on "Tick" button that is displayed at top right window corner.
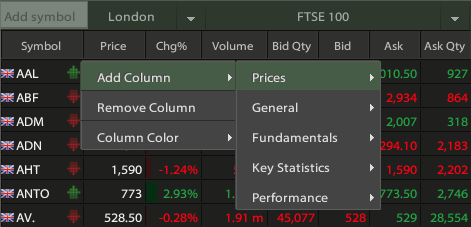
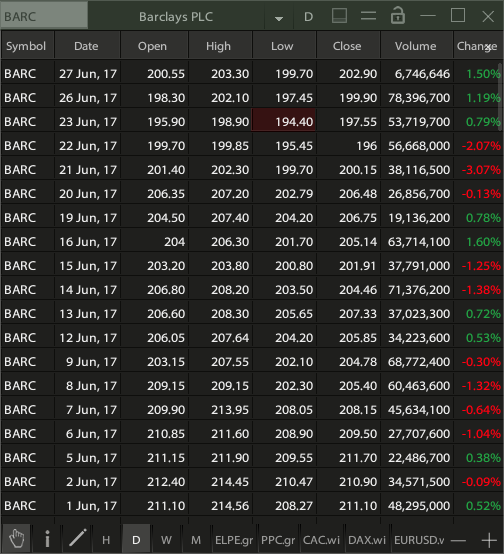
Add / Remove Columns
Right (or long) click on any column label to remove current column or add a new one after it.
By dragging a column you can change its width.
Click on a column label to sort the list according to this column data in ascending or descending order. Click again to remove sorting.
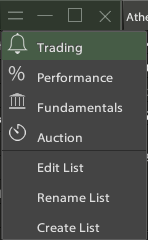
Column Sets
By clicking at Options Button (at the top left)
you can change the column set to Trading, Performance, Fundamental and Pre/After Market
(the last column set is same as Trading with addition of columns Pre/After Market Price and Change and it is auto selected when market is in Pre or After hours session).
You can alter these column sets by adding or removing columns or changing their width. All column sets are saved to your personal profile.
Charts
Open
In order to open a new Chart click on Window -> New and the select Chart or click on Chart shortcut icon  that is being displayed in main menu.
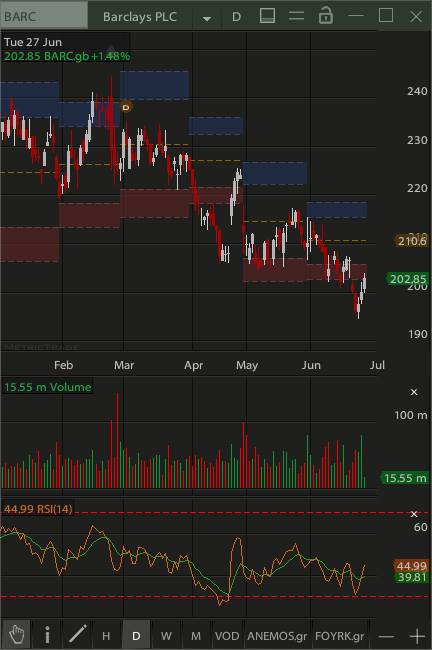
In technical analysis of the application you can see live charts in periods 5/10/30/60/120/240 minutes/day/week/month for time intervals of 120 days for intraday data ,10 years for daily and 15 years for weekly/monthly.
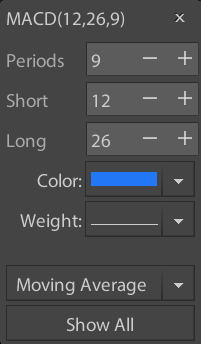
Add Indicators
You can add indicators and moving averages by pressing at Menu icon (at the top bar).
Choose another symbol by clicking at its edit box (at top left corner) or click at symbol name (at top center) and pick a symbol from your recent symbol list.
Change the chart interval with interval icon  (at the top bar).
Zoom in or zoom out by pressing the Subtract  or Add
  icons (at bottom right corner of the window).
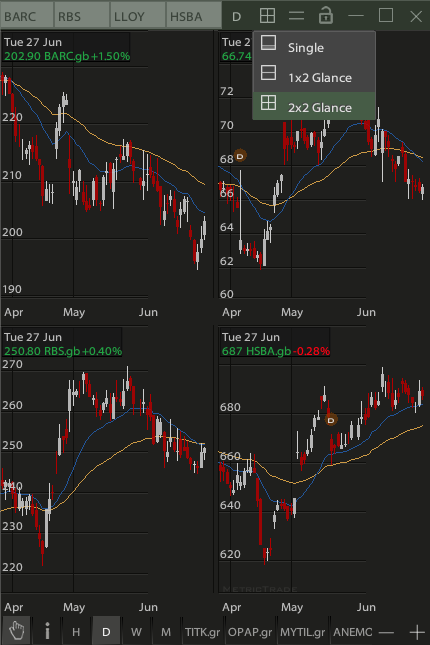
Glance View
By pressing the glance view icon  (at upper right corner), you can select the glance view where you
can watch 2 or 4 symbol charts simultaneously.
(at upper right corner), you can select the glance view where you
can watch 2 or 4 symbol charts simultaneously.
Draw Lines
Switch the cursor mode with Hand icon  (at bottom left corner) to the Normal, Floating Info Window
  or Drawing mode
  in order to draw lines.
You can select more drawing modes (Fibonacci Retracements, Rectangle or even Text) by pressing at Menu icon and then select Draw Lines.
Right (or long) click on a draw line to change its color, style or delete it.

Change Parameters
Click on a line or indicator to change its parameters or color or to add a moving average on it.
You can save the set of indicators on the chart as your default template by choosing
Menu icon and then select Set as default. After that any new chart will open with your saved overlays and indicators with your personal parameters.
Show historical prices
Press Ctrl+T to show the prices of the chart into a list. You can change the time frame of your list like the chart by selecting 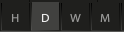 at the bottom of the screen or by changing the icon to the period you want.
By pressing Ctrl+T again you return to the chart window.
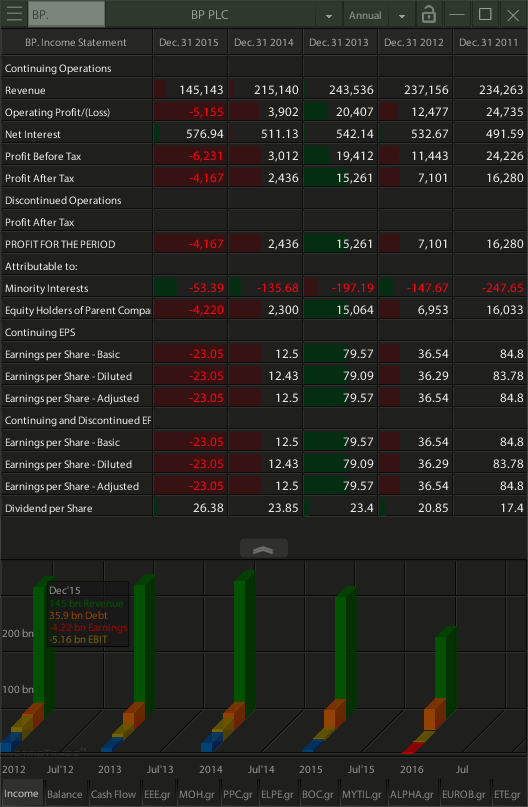
Fundamentals
20 Recent Quarters
The Fundamental data are the most important data in stock analysis.
In order to cover the Fundamental analysis needs, the application provides up to 20 recent quarters full with data along with its graphical representation.
Open
In order to open a new Balance Sheet window click on Window -> New and then select Balance Sheet or click on Balance Sheet shortcut icon  that is being displayed in main menu.
The user can click in any row of Balance Sheet in order to get its graphical representation and click at the same row again to remove it from graph.
The graph area can be resized by dragging the Slider icon  .
.
Please note that in Quarterly graphs the Debt represented as one quarter of Debt (Debt/4) in order to be comparable with quarter sales and earnings.
Fundamental Rules
The most important rules in Fundamental analysis from a trader's view are:
The stock price increase in long term must be supported with the sales increase.
The earnings increase must be supported with sales increase.
As result it is advisable to trade stocks with positive Revenue (sales) changes by checking
the Revenue 1 year Change % (most recent four quarters sales against its previous year corresponds)
and the Revenue 3 year Change (most recent twelve quarters sales against its previous year corresponds).
A rich set of Financial ratios along with its changes in 1 or is provided in all views (Watchlist or Quote).
In order to get the Fundamental view on your Watchlists you can click at Bell icon (at the top left) and then select Fundamental from the menu.
Quote
Open
In order to open a new Quote window click on Window -> New and the select Quote or click on Quote shortcut icon  that is being displayed in main menu.
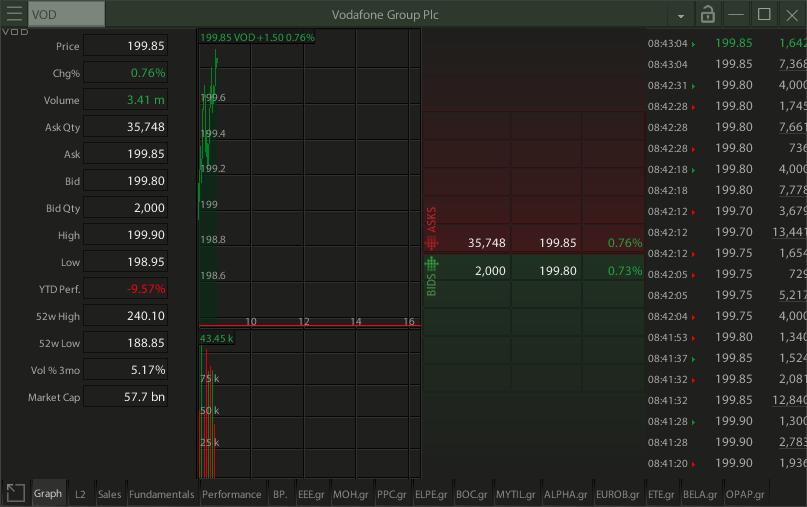
Quote Options
The available options in Quote screen are News (if there is any news that has been announced for the selected stock), Graph, Sales, L2, Fundamentals and Performance. You can select any of the above by simply clicking on the options that are being displayed on the lowest row of the window.
In the Sales tab you can see the symbol Trades and in L2 the Bid/Ask table.
By clicking at Maximize icon  you can expand the options area
and then restore it with the same action.
you can expand the options area
and then restore it with the same action.
Change Quote View
You can remove or add any column by right (or long click) on any column label.
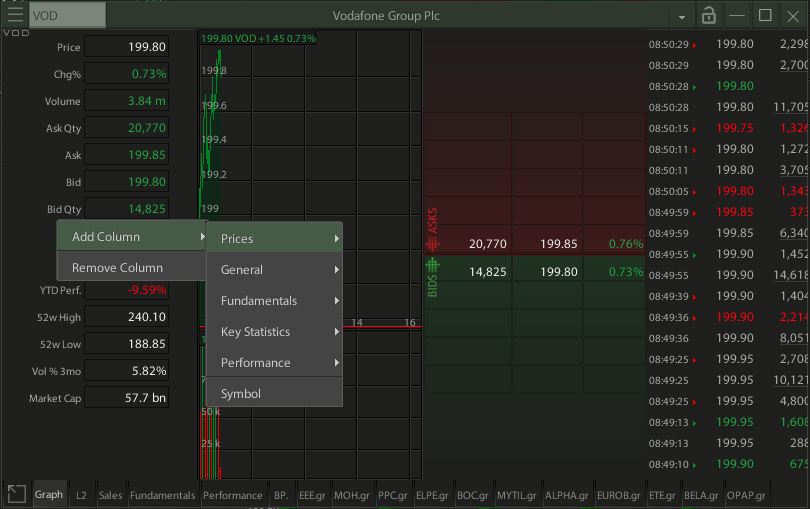
Quick Switch
From Options icon (on top left corner)
you can directly switch to the Chart, Balance Sheets, Options or Buy/Sell screen for the same symbol.
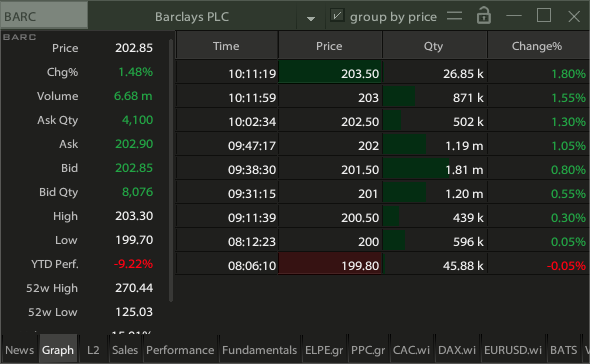
Trades
By pressing Ctrl+T the list with all the trades for the ticker you watch comes up. You can select to view all the trades that take place for the current symbol or group them by price by ticking the box "group by price".
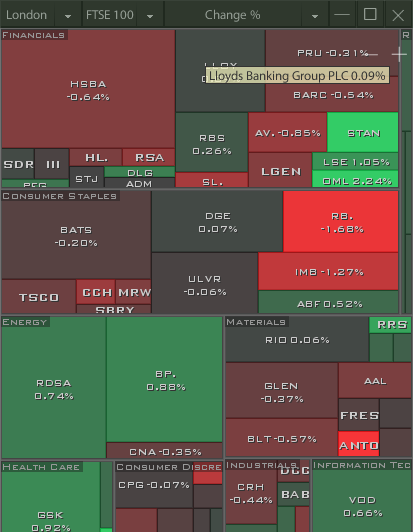
Heat Map
Heat maps are industry-proven investment tools that synthesize complex data to help you make faster and better trading decisions.
Open
In order to open a new Heat Map window click on Window -> New and the select Heat Map.
By clicking at any symbol on Heat Map you can immediate have its Quote or Chart in any window that is unlocked in the selected Market Tab.
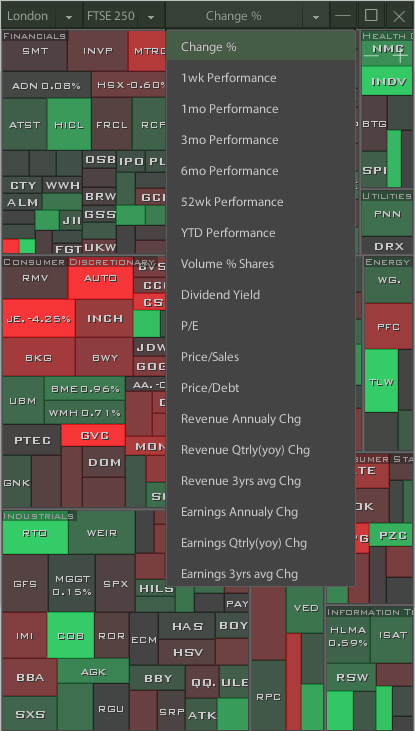
Other Values to Compare
By clicking at right label (Change %) you can select another value to compare from the menu.
The displayed color depends on characteristic value.
The covered stock area depends always on its Market Capitalization.
Alerts
In the Alerts screen you can put alerts on whether a title is above or below a price.
You can also add a comment that will be displayed along with the alert.
From the application settings (paragraph 3), you can enable or disable vibration accompanying the appearance of an alert.
CAUTION: Alerts do not work when the application is not running.

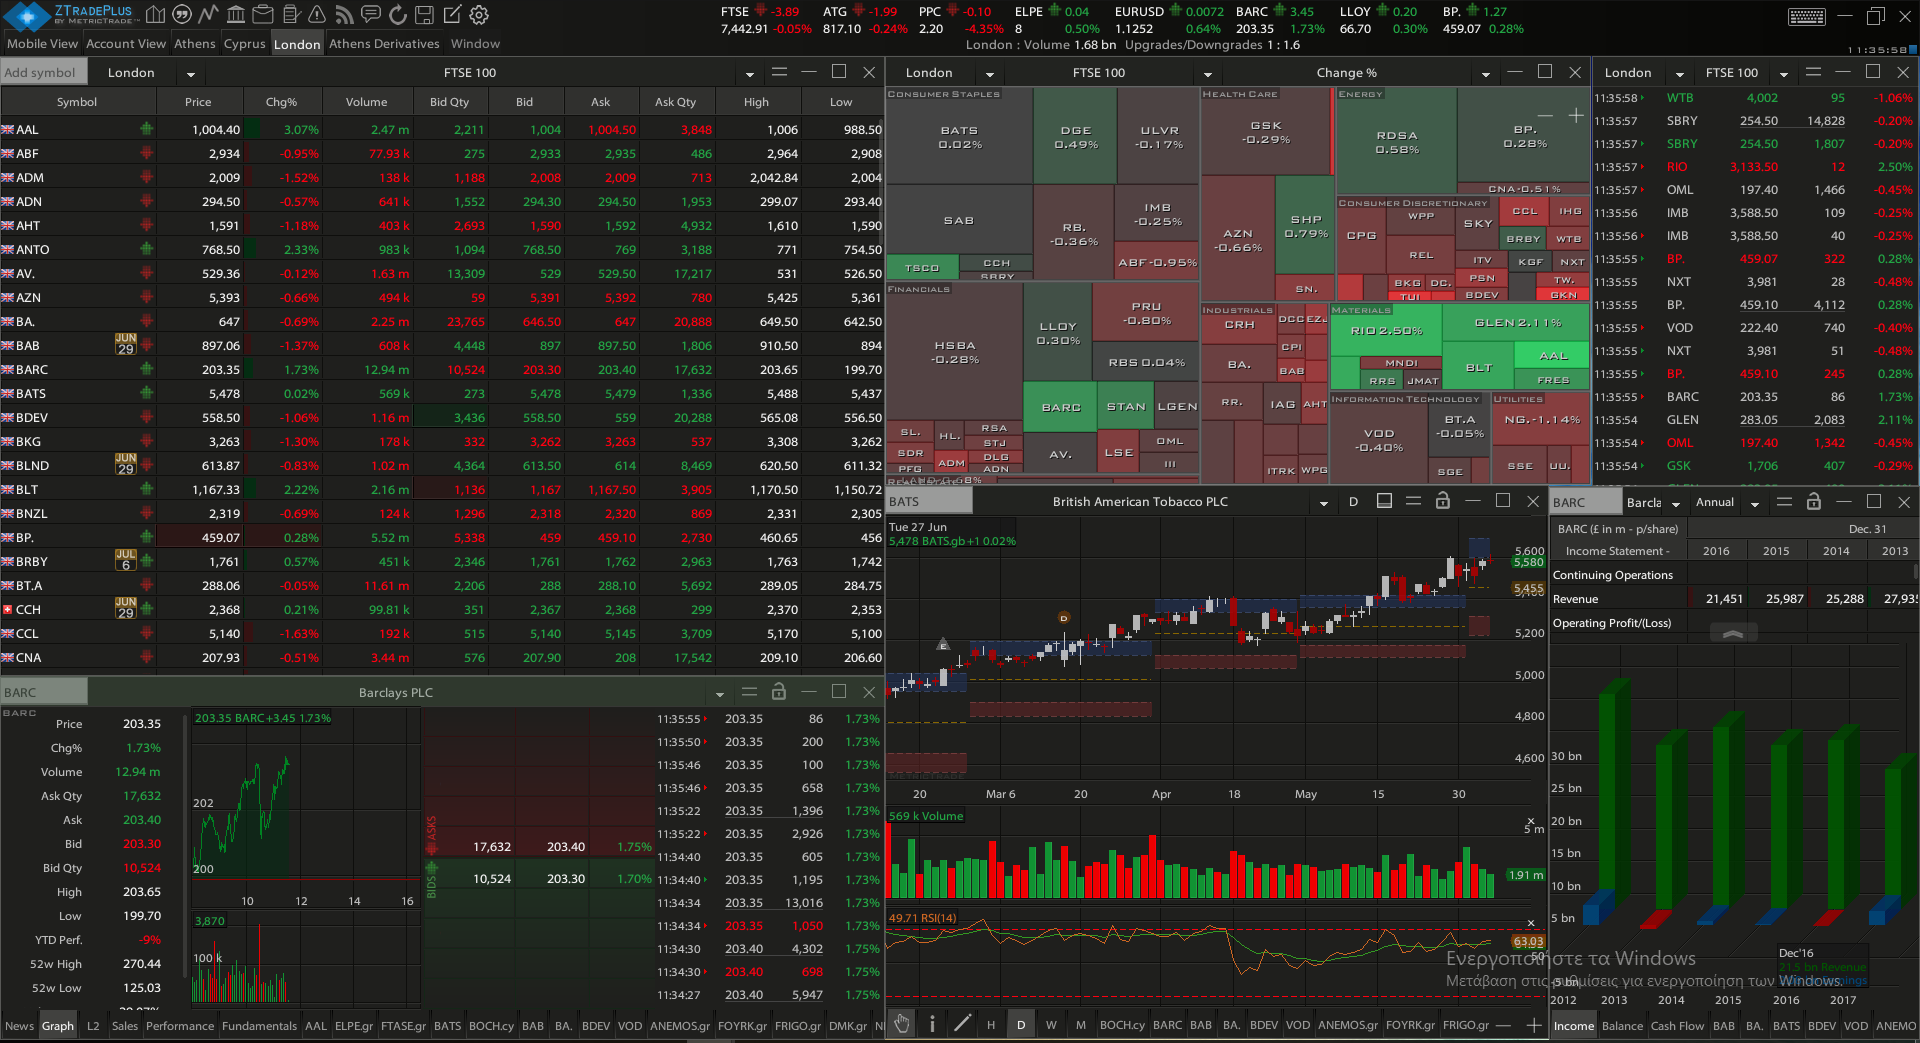
Desktop Version
Desktop version of the application offers new features to better organize one or more screens in your PC aimed at improving the functionality of the application.
User Interface Description
User Interface Description
The user has 4 different Screens to set up ( Athens, Cyprus, London, World Markets). Mobile screen contains the layout that the user has configured from his mobile devices. Each screen is fully customisable according to the user's needs.
Up to 64 windows can be opened on each Market Tab. Each window can be moved, rearranged and resized anywhere in the screen. A window can be resized by dragging the bottom right corner or by moving it on the edges of the screen. Also the size of the main window can be changed in the same way.
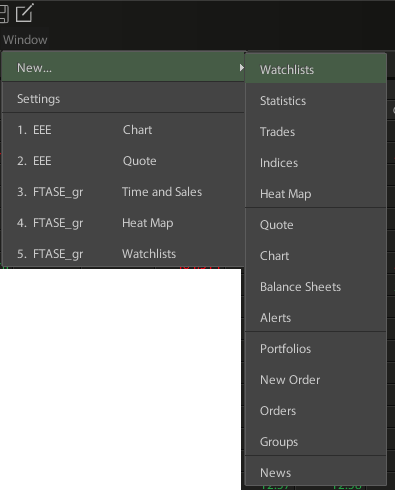
Open a new window
Option 1:
By clicking on Window option and selecting "New" a list of all types of windows opens. Then by selecting the preferred window type, the new window opens in the current Market Tab.
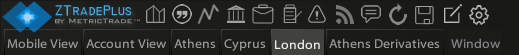
Option 2:
A new window can be opened quickly by clicking on the appropriate shortcut icons that are displayed on the top of main window.
 to open Market Statistics Window
Select to open Quote Window
Select to open Chart Window
Select to open Balance Sheet Window
Select to open Portfolios Window
Select to open New Order Window
Select
to open Market Statistics Window
Select to open Quote Window
Select to open Chart Window
Select to open Balance Sheet Window
Select to open Portfolios Window
Select to open New Order Window
Select  to open Alerts Window
Select
to open Alerts Window
Select  to open News Window
Select
to open News Window
Select  to open Messages Window
Lock/Unlock
Quote, Chart and Balance Sheet windows contain a locked/unlocked icon 
 (on upper right corner). A window can be locked in order to always display the symbol that is currently displayed.
If the window is unlocked the content of the window changes, and displays each time the symbol that the user clicks on.
(on upper right corner). A window can be locked in order to always display the symbol that is currently displayed.
If the window is unlocked the content of the window changes, and displays each time the symbol that the user clicks on.
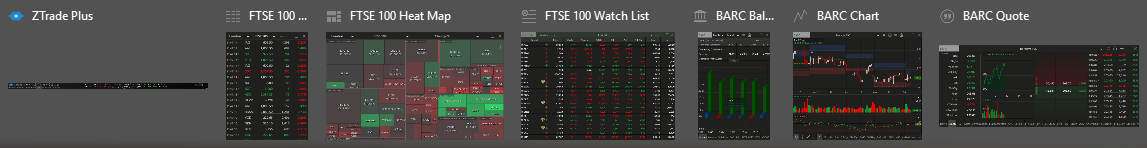
Preview Windows
Preview
On the Taskbar of your PC or Mac you can see the preview of all the screens that are opened at the selected Market Tab.
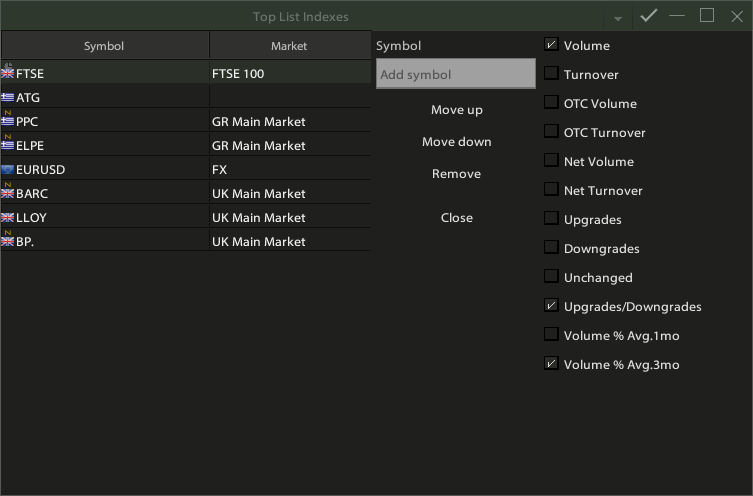
Top List Indexes
Ticker List
At the top of the main window there are some predefined symbols with their specific values that are being displayed.

The list of the symbols that are displayed and their attributes can be changed by clicking on  'Edit list button' on the main menu.
On the window that appears the user can select the symbols and their attributes that he wants to be displayed on the ticker.